Add custom points with descriptions
Pycoast can add a symbol to points of interest on an image. The following examples show how
we might use the add_points() method to annotate the
points on an image.
First of all, we setup a PIL image with an area definition, then we add coastlines and borders for reference.
>>> from PIL import Image
>>> from pycoast import ContourWriterAGG
>>> img = Image.new('RGB', (1024, 1024), (255, 255, 255))
>>> proj4_string = '+proj=laea +lat_0=90 +lon_0=0 +a=6371228.0 +units=m'
>>> area_extent = (-5326849.0625, -5326849.0625, 5326849.0625, 5326849.0625)
>>> area_def = AreaDefinition('nh', 'nh', 'nh', proj4_string, 1024, 1024, area_extent)
>>> cw = ContourWriterAGG('/home/esn/data/gshhs')
>>> cw.add_coastlines(img, area_def, outline='black', resolution='l', level=4)
>>> cw.add_borders(img, area_def, outline='black', width=3, level=1, resolution='c')
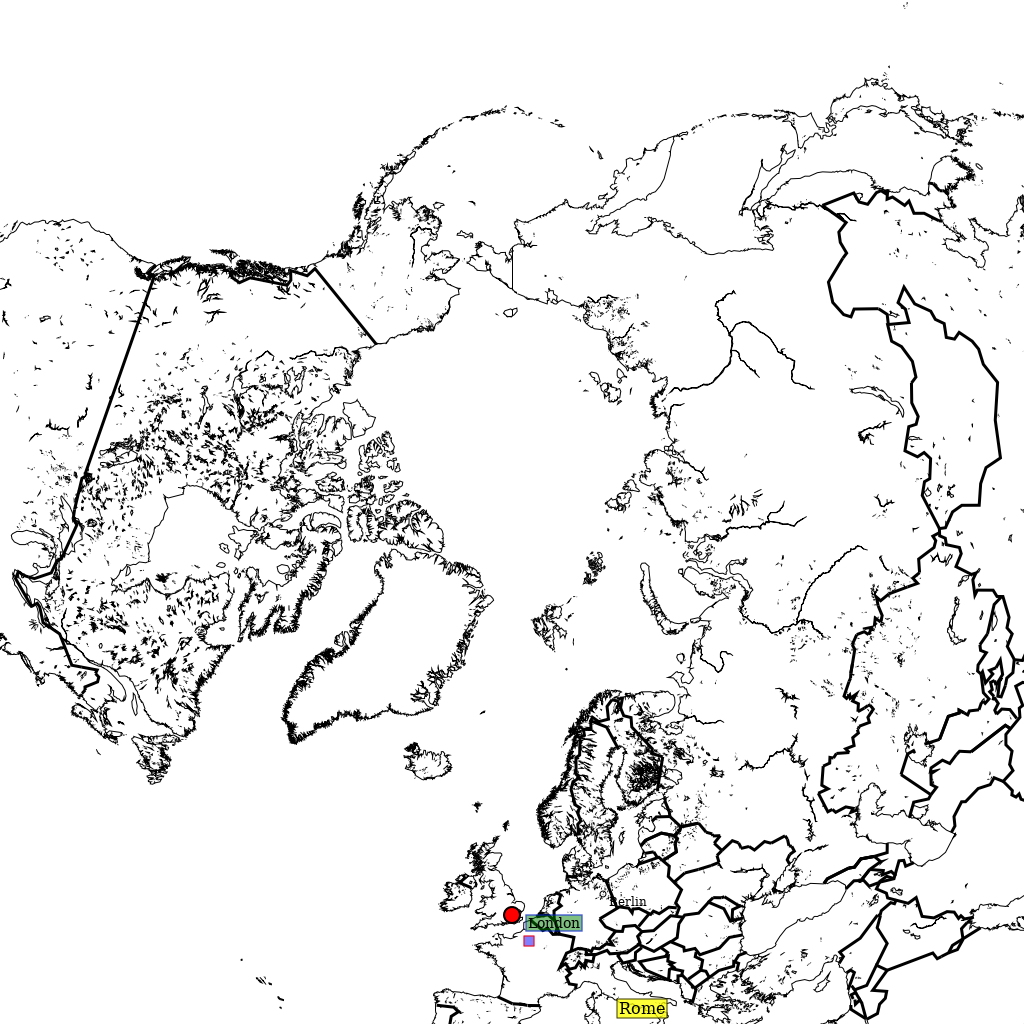
Now we can add a circle, which is the default symbol, with default point size 6 at the location of Berlin, the name of the location will marked in a text box with black borders and the default text size is 12.
>>> points_list = [((13.4050, 52.5200), 'Berlin')]
>>> cw.add_points(pil_img, area, points_list=points_list, font_file=font_file)
We can also annotate the image with text only by setting the ptsize to 0. The example below will add ‘Rome’ at the given location without a symbol.
>>> points_list = [((12.4964, 41.9028), 'Rome')]
>>> cw.add_points(pil_img, area, points_list=points_list,
...               font_file=font_file, font_size=16,
...               symbol='circle', ptsize=0,
...               box_outline='black', text_linewidth=1,
...               box_fill='yellow', box_opacity=200)
Similarly, assign the description as an empty string will only draw the symbol on the image. The example below will draw a square symbol at the location of Paris.
>>> points_list = [((2.3522, 48.8566), '')]
>>> cw.add_points(pil_img, area, points_list=points_list,
...               font_file=font_file,
...               symbol='square', ptsize=10,
...               outline='red', width=1,
...               fill='blue', fill_opacity=128)
Finally, we can fully customize the annotation as the example below, which will add a circle in black with line width set to 2 and filled in red color with opacity equals 255; the description will be ‘London’ in a textbox with blue borders and filled with green color with opacity set to 128.
>>> points_list = [((0.1278, 51.5074), 'London')]
>>> cw.add_points(img, area_def, points_list=points_list,
...               font_file=font_file, font_size=14,
...               symbol='circle', ptsize=14,
...               outline='black', width=2,
...               fill='red', fill_opacity=255,
...               box_outline='blue', box_linewidth=1.5,
...               box_fill='green', box_opacity=128)
>>> img.show()
Please check out the docstrings of the add_points()
function for the full description of the parameters.
Moreover, we can organize the overlay parameters in a dictionary and use add_overlay_from_dict()
to apply the overlays in one shot.
>>> points = {'points_list': [((2.3522, 48.8566), 'Paris'), ((0.1278, 51.5074), 'London')],
...           'font': font_file,
...           'symbol': 'circle', 'ptsize': 16,
...           'outline': 'black', 'width': 3,
...           'fill': 'red', 'fill_opacity': 128,
...           'box_outline': 'blue', 'box_linewidth': 0.5,
...           'box_fill': 'yellow', 'box_opacity': 200}
>>> overlays = {'coasts': {'outline': 'black', 'level': 4, 'resolution': 'l'},
...             'borders': {'outline': 'black', 'width': 3, 'level': 1, 'resolution': 'c'},
...             'points': points}
>>> img = cw.add_overlay_from_dict(overlays, area_def)
>>> img.save('./add_overlays_from_dict.png')
Here we have used the points key in the overlays dict to pass a list of points. We could also use the text key in the overlays dict, which is just an alias, they both behave the same. This allows for two different lists of points to be plotted with their own rendering styles. Setting symbol:None and ptsize:0 will render just text without a symbol, but this is not automatically implied by the use of text.
The coordinates of the point are specified in geographic degrees longitude (N), latitude (E) by default but can be changed to projected image coordinates in pixels (right, down). Use the coord_ref key in your points dict and with a value ‘lonlat’ or ‘image’. Negative image coordinates will go left/up from the opposite side of the image.
Thus the dict overlays = { ‘text’: { ‘symbol’:None, ‘ptsize’:0, ‘coord_ref’:’image’ can be used to plot text strings at fixed points on the image regardless of projection.