Shapes from ESRI shape files
Pycoast supports plotting of polygons and polylines from ESRI shapefiles,
currently only in lonlat coordinates format.
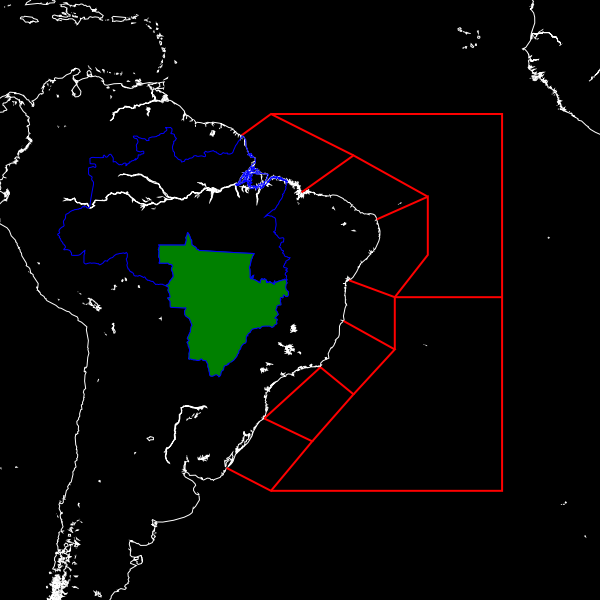
In the following example we use add_shapefile_shapes method to plot all line shapes
found in the file Metareas.shp. We then use the add_shapefile_shape (notice the singular)
to plot only the 3rd and 4th shape_id within the file BR_Regioes.shp.
>>> from pycoast import ContourWriter
>>> img = Image.new('RGB', (600, 600))
>>> proj4_string = '+proj=merc +lon_0=-60 +lat_ts=-30.0 +a=6371228.0 +units=m'
>>> area_extent = (-2000000.0, -5000000.0, 5000000.0, 2000000.0)
>>> area_def = (proj4_string, area_extent)
>>> cw = ContourWriterAGG(gshhs_root_dir)
...
>>> cw.add_coastlines(img, area_def, resolution='l', level=4)
>>> cw.add_shapefile_shapes(img, area_def,
                            'test/test_data/shapes/Metareas.shp',
                            outline='red',width=2)
>>> cw.add_shapefile_shape(img, area_def,
                            'test/test_data/shapes/divisao_politica/BR_Regioes.shp',
                            3, outline='blue')
>>> cw.add_shapefile_shape(img, area_def,
                            'test/test_data/shapes/divisao_politica/BR_Regioes.shp',
                            4, outline='blue', fill='green')
If your shapefile is not in lonlat coordinates, then you can re-project your shape file using
ogr2ogr (part of GDAL tools), e.g.
$ ogr2ogr original.shp lonlat.shp -t_srs "+proj=latlong"
This should work if you have all the extra meta-files original.* included with your original.shp. Please refer to the OGR documentation for more information.